Hi there!
This month we are introducing a new Analytics API – an aggregation API that crosses ALL our resources in the following form: /totals/
The Analytics API enables you to retrieve aggregated results from thousands of records, within a few seconds, grouped by any API field name and filtered by any SQL-Style applicable.
See for example the Transaction Lines Totals, the Inventory Totals and once again – ALL Pepperi resources now include the totals API.
So, lets take a look at one good example – let’s say I want to build a nice Pie Chart of Sales per Brand. To get this data all I need to do is perform the following request :
GET /v1.0/totals/transaction_lines?select=sum(Transaction.GrandTotal) as SumGrandTotal&group_by=Item.MainCategoryID as Brand
The result would be :
[
{
"Brand": "Nike",
"SumGrandTotal": 136100326.83340874
},
{
"Brand": "Adidas",
"SumGrandTotal": 142329502.61878213
},
{
"Brand": "Reebok",
"SumGrandTotal": 609653.4861999999
}
]
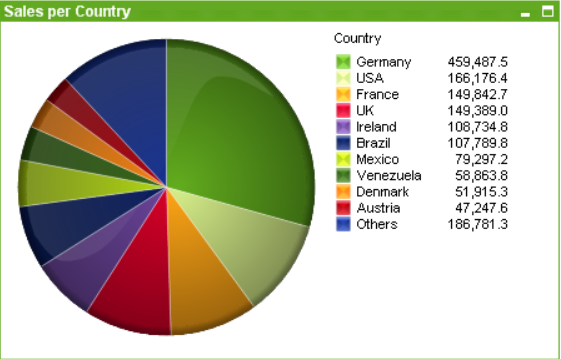
Homework – what API request would it take to build the attached Pie Chart of Sales Per Country? ![]()
That’s it for this release – I am sure you’ll enjoy our Analytics API – it saves a lot of coding work and even more importantly – retrieves results MUCH FASTER.
Happy integrating!
Yossi Rotlevy
VP of Data Integration & Co-Founder
Pepperi
